Guide ·
Nike Air Max price history: what changed over 90 days
Nike Air Max prices fell by a median 11% over 90 days across the 54 products with sufficient history. The latest 30-day median is down 6%, but individual colourways have followed very different paths, making timing and shop coverage important parts of the comparison.
The 90-day direction is clearly downward
Across Nike Air Max, the median price movement over the last 90 days is -11%. That figure is based on 54 products with enough price history, rather than all 387 live products. It is therefore a useful reading of the pairs that can be followed over the full period, not a promise that every Air Max colourway has become cheaper by the same amount. Some have fallen much further, while others have moved only slightly or even risen.
The median matters because it reduces the influence of unusually large changes. A few deep reductions do not create the entire downward result: the middle tracked product is itself 11% lower over 90 days. For someone comparing colourways, that establishes a practical baseline. A move close to -11% broadly follows the tracked group; a fall around -20% or more is materially stronger; a small single-digit reduction is relatively restrained even though its direction is still downward.
The latest 30 days show a slower median decline
Over 30 days, the median Air Max movement is -6%. The shorter window therefore remains negative, but it should not be read as one third of the 90-day result or projected mechanically into the future. The two periods overlap, and individual products can change pace sharply. What the comparison does show is that falling prices have not been confined to an older part of the 90-day window: the median direction has also been downward more recently.
This is where colourway-level history becomes more useful than the family median. A pair can have a modest 90-day decline and a much steeper 30-day move, signalling that most of its change happened recently. Another can show a large 90-day fall but a softer latest month, suggesting that the main adjustment came earlier. Comparing both windows helps distinguish a continuing reduction from a price that has already completed much of its move.
The Moto 2K colourways did not move together
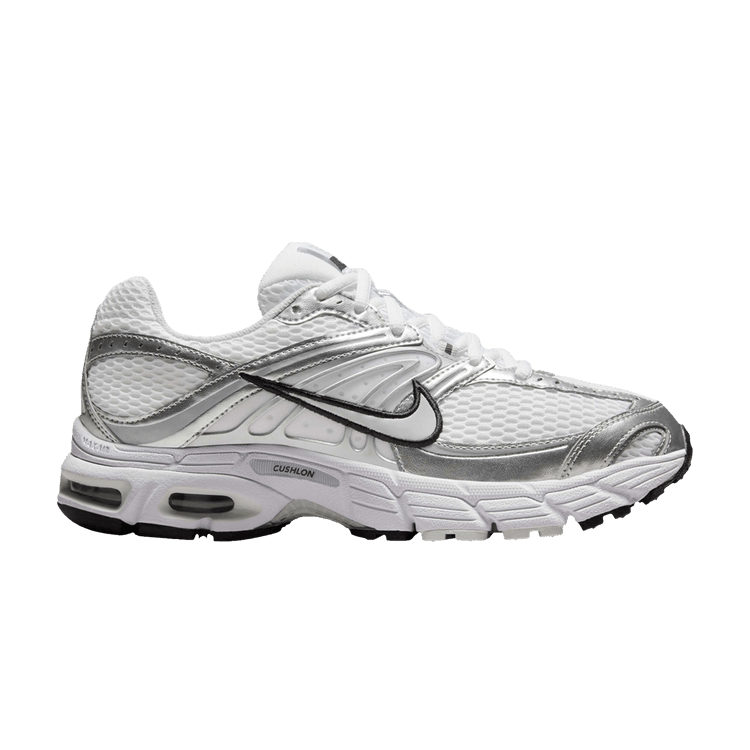
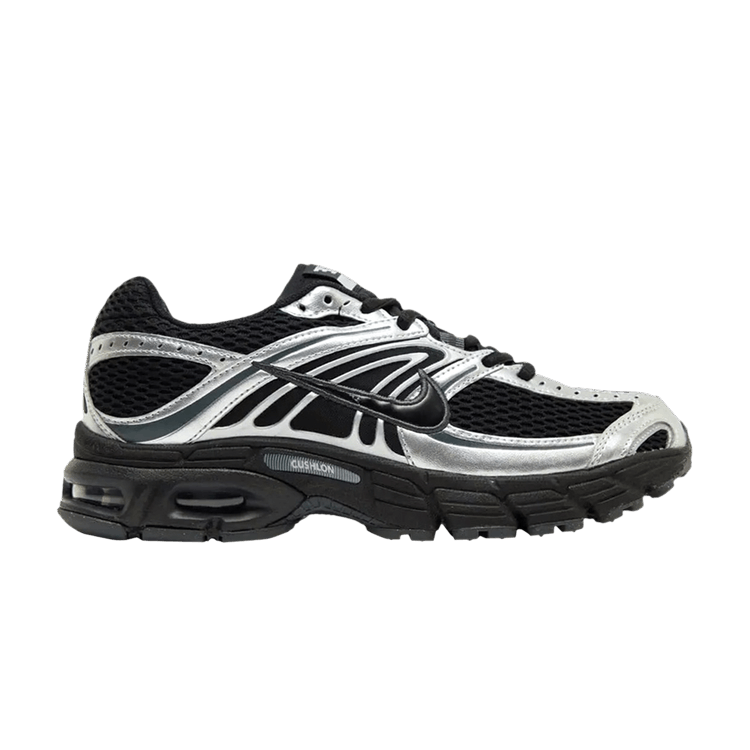
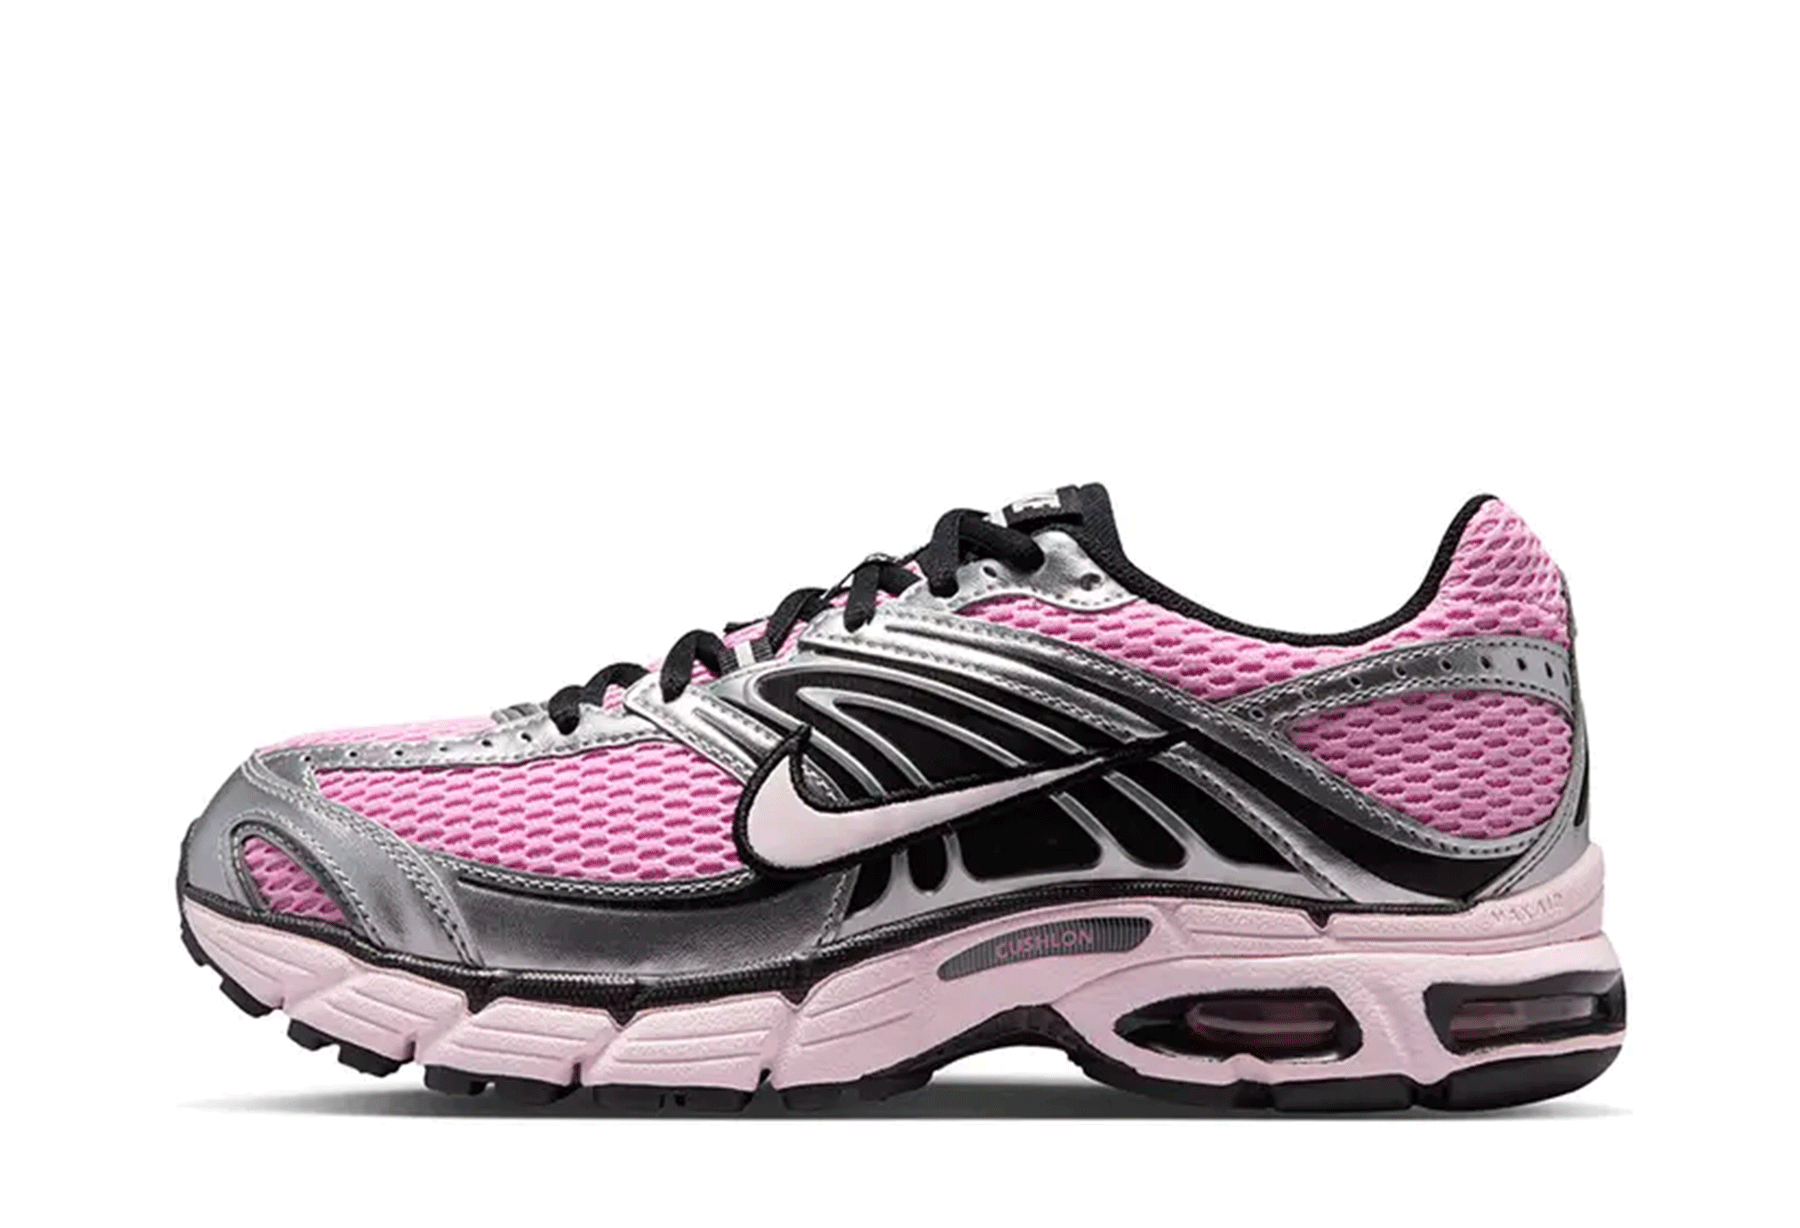
The selected Air Max Moto 2K examples make that divergence clear. The women’s Pearl Pink Silver fell 30% over 90 days, Black Metallic Silver fell 28%, and the women’s Sail Phantom Pale Ivory declined 21%. All three moved substantially more than the Air Max median of -11%, but their latest monthly paths differ: -13%, -42% and -24% respectively. Black Metallic Silver has the sharpest recent decline of the three, while Pearl Pink Silver records the largest 90-day fall despite a less severe latest month.
Five widely distributed Moto 2K examples show how differently the two time windows can behave.
| Colourway | Style code | Shops | 30-day move | 90-day move |
|---|---|---|---|---|
| White Metallic Silver | HQ2056-103 | 14 | -32% | -5% |
| Smoke Grey Anthracite Pink Foam White | IU7548-070 | 14 | -18% | -17% |
| Sail Phantom Pale Ivory | IO4862-100 | 13 | -24% | -21% |
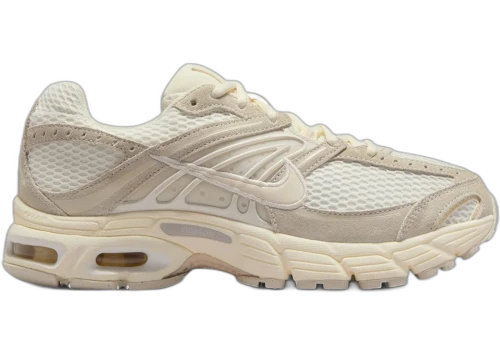
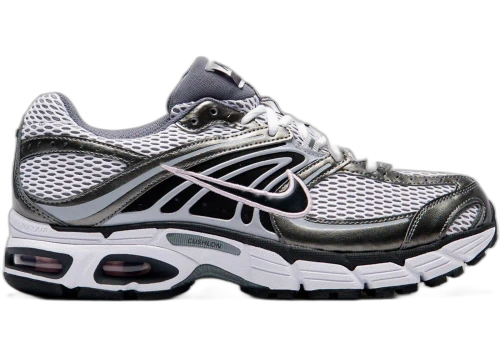
| Black Metallic Silver | HQ2056-007 | 13 | -42% | -28% |
| Pearl Pink Silver | HQ2056-601 | 12 | -13% | -30% |
These three Moto 2K colourways have 90-day declines of 21% to 30%; compare their individual histories rather than treating the silhouette as one price trend.
Moderate 90-day moves can hide recent acceleration
The women’s White Metallic Silver pair, listed under the White Black name, is the clearest example. Its 90-day change is only -5%, less than half the model-wide median decline, yet its 30-day movement is -32%. The two figures are not contradictory. Together they indicate that the recent month was much weaker than the full-period result, so the 90-day number alone understates the latest pace of change. It is also the most widely distributed of these examples, appearing across 14 shops.
Smoke Grey Anthracite Pink Foam White provides a more even pattern. It fell 17% over 90 days and 18% over 30 days, with coverage across 14 shops. Its longer movement is six percentage points below the Air Max median, but there is much less separation between its short- and long-window percentages than on White Metallic Silver. When choosing when to compare offers, this distinction is more informative than simply ranking the pairs by their 90-day result.
A steep recent decline can justify checking comparisons more frequently, because the displayed relationship between shops has been changing quickly. It does not establish that another reduction will follow. Equally, a moderate 90-day decline does not by itself mean that waiting is preferable: the 30-day history may already show acceleration, and the suitable size may be represented less broadly than the overall shop count suggests.
Shop coverage changes the practical buying window
The five tracked Moto 2K pairs in the table appear across 12 to 14 shops. That is unusually broad compared with the Air Max median of two shops per product, and it reaches the model-wide maximum of 14 in two cases. Broad shop coverage creates more points of comparison and can make it easier to monitor whether a downward move is shared across retailers or concentrated in only part of the market.
Coverage is not the same as size breadth, however. The five examples are represented somewhere in 15 to 23 sizes: White Metallic Silver and Black Metallic Silver each reach 23, Smoke Grey and Sail Phantom reach 17, and Pearl Pink Silver reaches 15. Those totals describe how broadly the products are represented by size somewhere across shops, not whether any particular size is available at a given moment. A colourway with fewer represented sizes can offer less room to wait even when its overall shop count remains high.
- White Metallic Silver: 14 shops, 23 sizes represented somewhere, -5% over 90 days.
- Smoke Grey Anthracite Pink Foam White: 14 shops, 17 sizes represented somewhere, -17% over 90 days.
- Sail Phantom Pale Ivory: 13 shops, 17 sizes represented somewhere, -21% over 90 days.
- Black Metallic Silver: 13 shops, 23 sizes represented somewhere, -28% over 90 days.
- Pearl Pink Silver: 12 shops, 15 sizes represented somewhere, -30% over 90 days.
When waiting fits the history—and when it does not
The broad signal supports patience, but only conditionally. A median decline of 11% over 90 days and 6% over 30 days shows that tracked Air Max prices have generally moved down in both windows. For colourways spread across 12 to 14 shops, there is also a substantial comparison set. Waiting and checking again can therefore be reasonable when several suitable size options remain represented and the recent movement is still clearly negative.
The limits are just as important. Only 54 of the 387 live Air Max products have sufficient 90-day history, so the median cannot describe every pair on the page. Even within the selected Moto 2K group, the 90-day results run from -5% to -30%, while the corresponding 30-day changes run from -13% to -42%. A family-level trend should set context, not replace the history of the exact style code being considered.
For White Metallic Silver, the sharp 30-day decline makes the latest comparison more relevant than its restrained 90-day result. For Pearl Pink Silver, the 30% fall over 90 days has already been substantial, while its 15 represented sizes make size coverage more important to the timing decision. Black Metallic Silver combines a 28% 90-day decline with a 42% fall over 30 days and broad size representation, so both its current comparison and the direction of its recent history deserve attention. None of those patterns guarantees the next move; they simply define different windows in which to look.
Compare the recent and 90-day paths of these widely distributed Moto 2K colourways; the same shop coverage can accompany very different price histories.
Use the Air Max hub to compare exact style codes and the Nike size pages to keep size coverage alongside price history.